Hovering over a particular data element Compare Chart or Graph with your mouse will display the information and details icons.
Hovering over the Information Icon (“i” on the upper right) will show you the definition and a calculation explanation when unknowns are present. We exclude unknowns when calculating percentages.
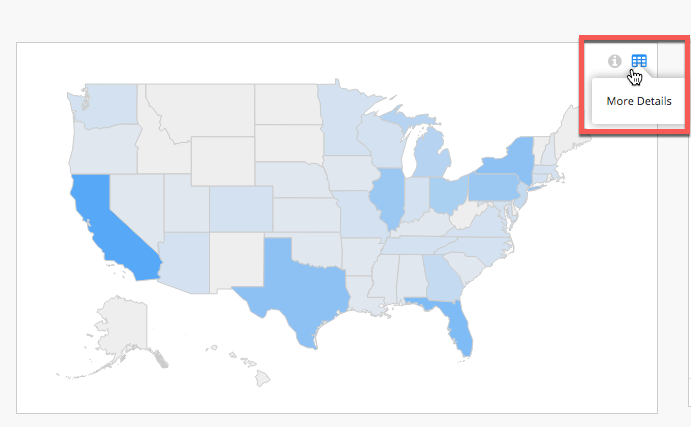
Clicking on the More Details icon (also on the upper right adjacent to the Information Icon) will take you to the data elements Compare Detail Chart and Table page.